VCF 9.1 – What’s New? VCF Operations Real-Time Metrics
Operations in VCF 9.1 now has the ability to display real-time (2sec) granular metrics for vCenter, ESX, NSX and vSAN. This is essentially bringing ESXTop metrics into VCF Ops for a more streamlined experience.
Before we can utilize this, we need to deploy the real-time metrics component into the VCF Management Services Cluster.
Deployment
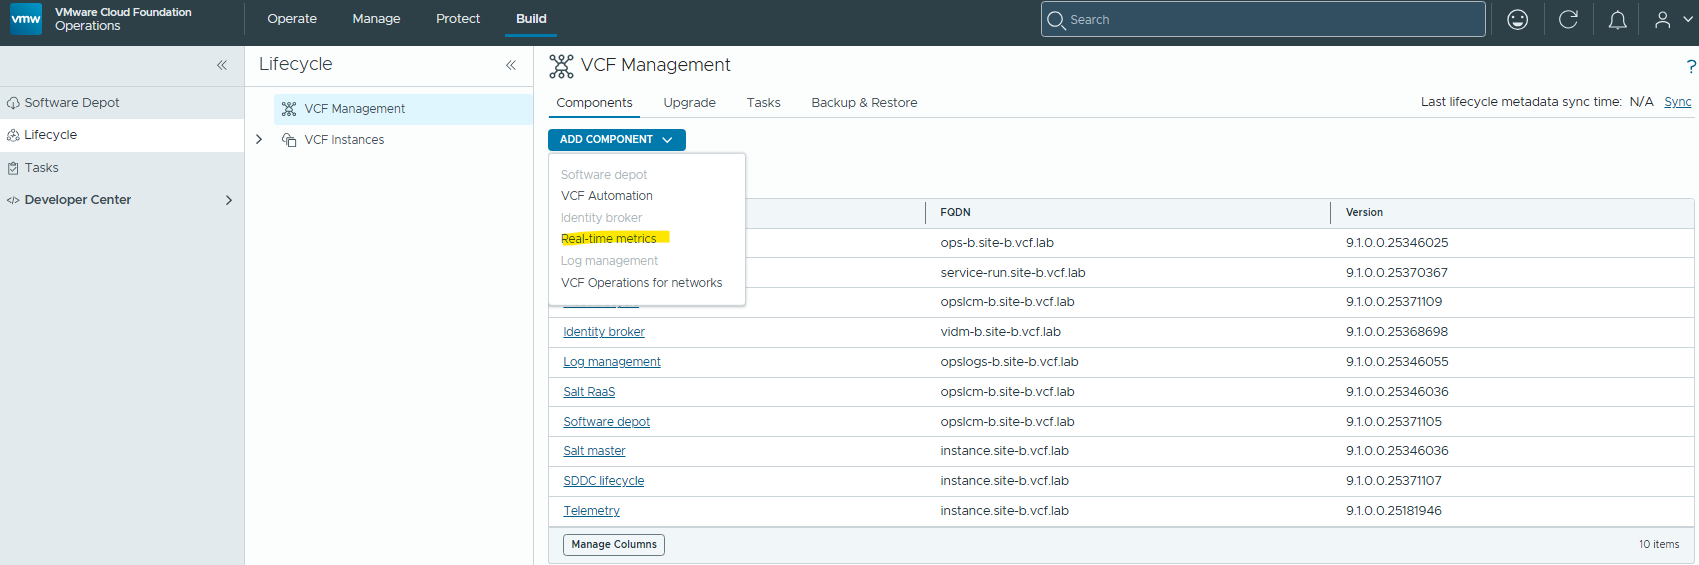
Browse to Build / Lifecycle / VCF Management / Add Component / Real-Time Metrics
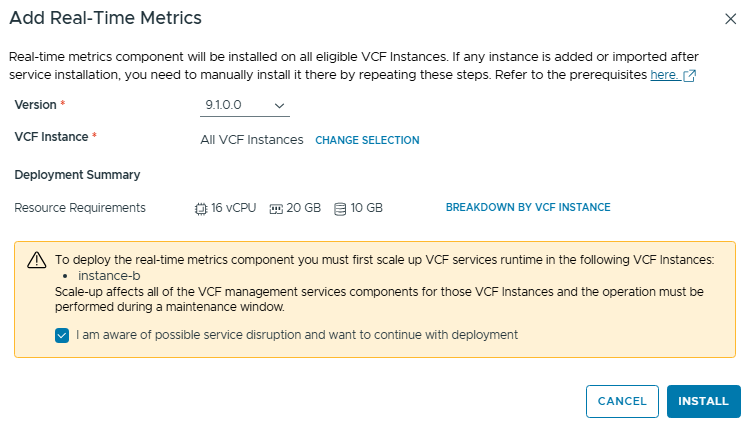
Review the resource requirements and warning message, then click Install.
Monitor the deployment task, once complete we can start to enable real-time metrics where required.
Configuration
Now to enable the real-time metrics, we need to edit the VCF Operations policy. This sort of granular troubleshooting data may only be relevant during troubleshooting of a specific issue, so you can use VCF Operations policies to limit the scope to specific hosts or vCenters.
Since this is just a test lab, I’ll be editing the Default policy to enable this globally.
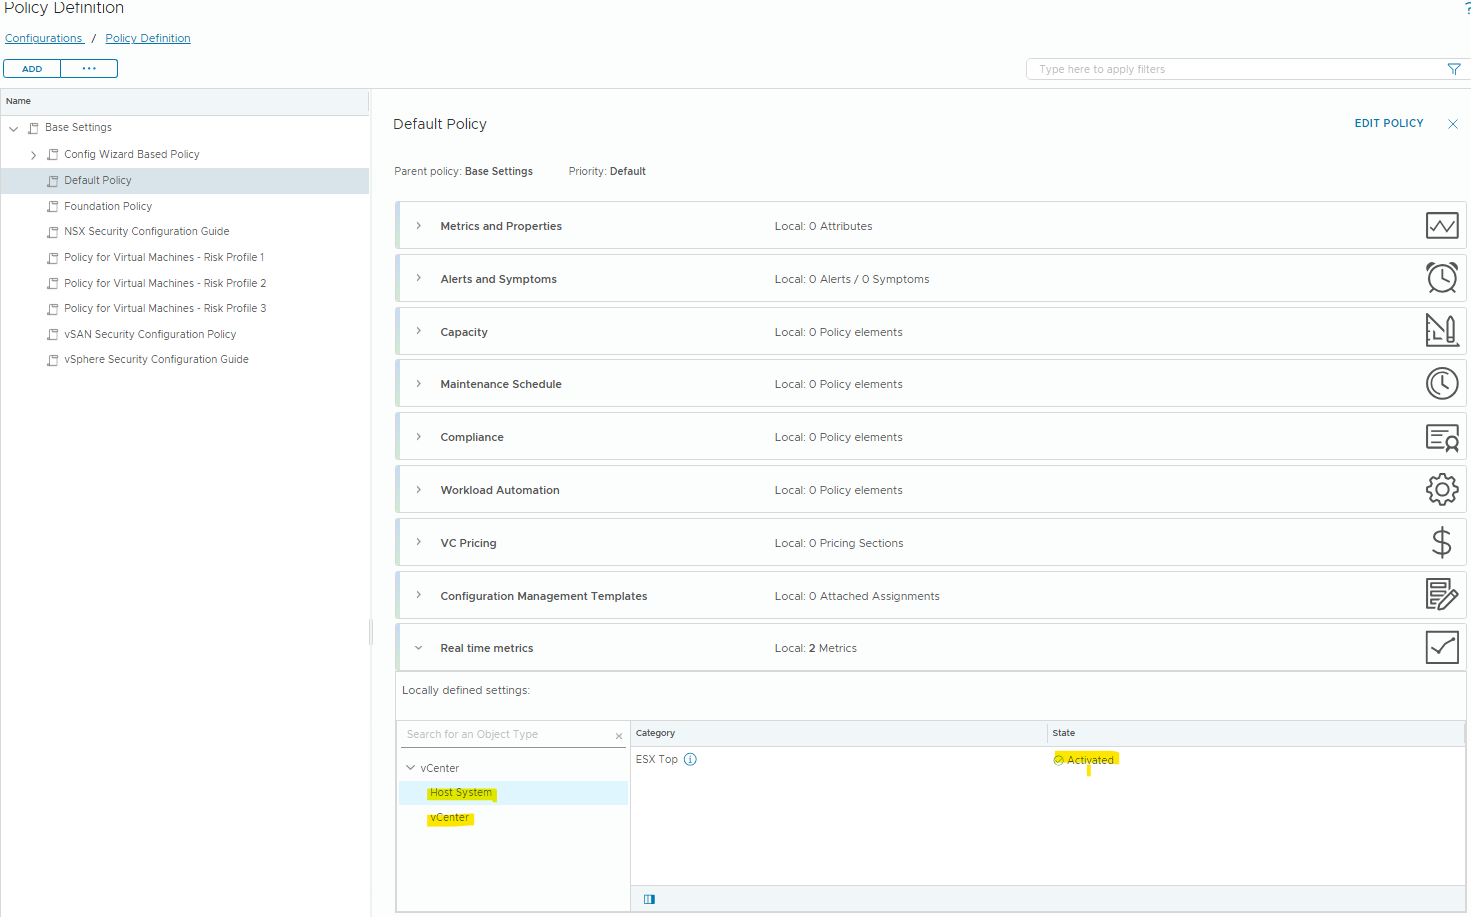
Browse to Operate / Administration / Configurations. Click on Policy Definition and edit the Default Policy.
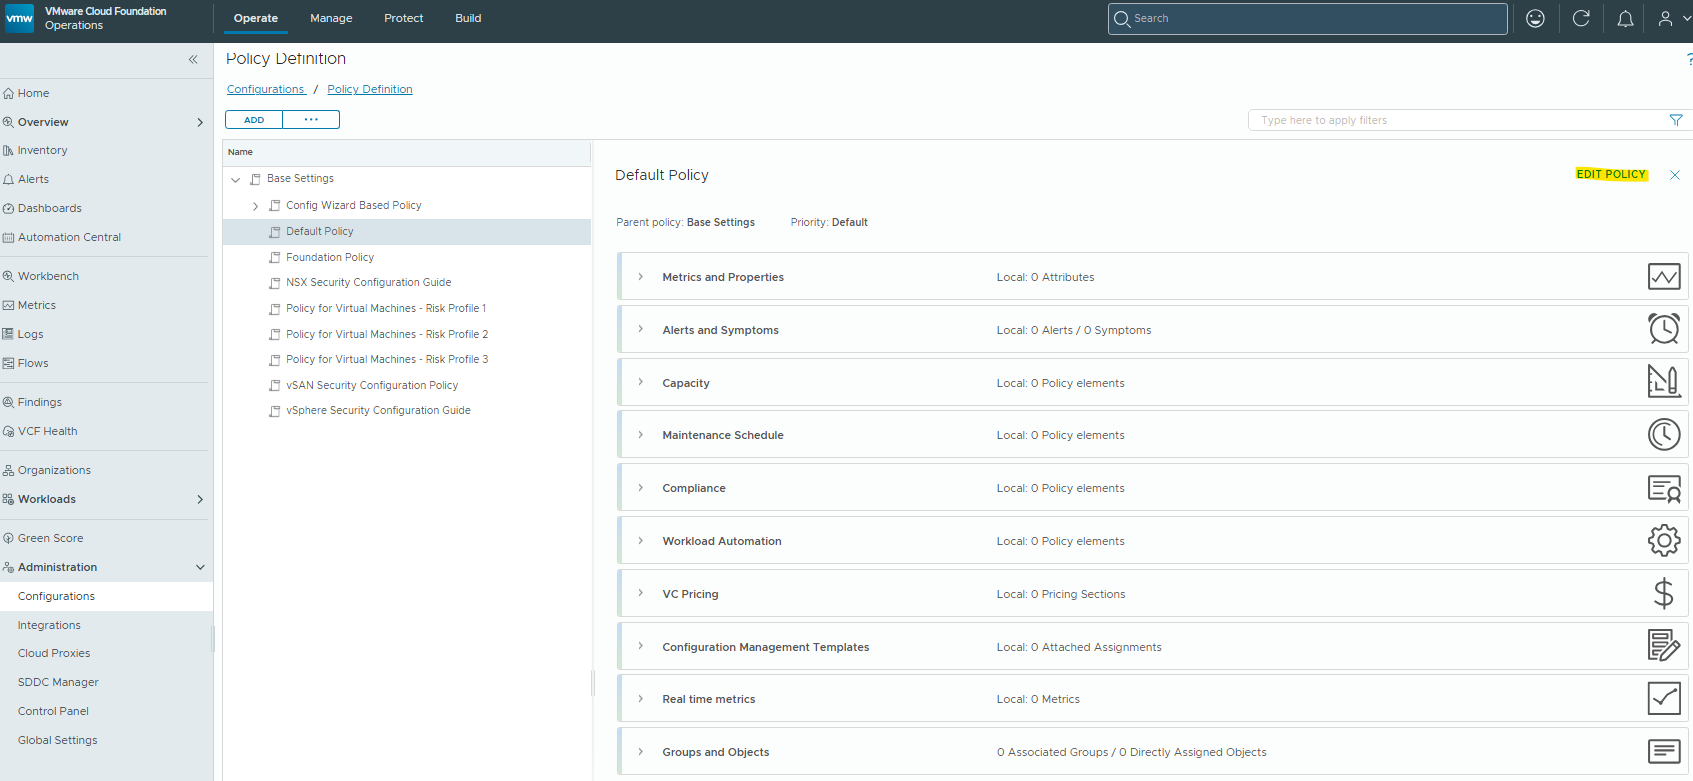
Click on the “Real Time Metrics” tile
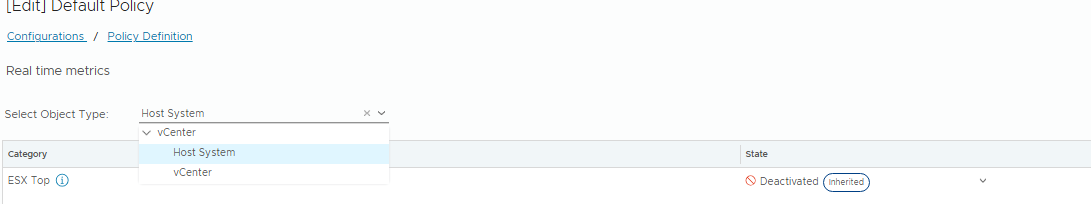
Now we want to enable “Host System / ESX Top” and “vCenter / Standard”. Click Save.
It may take a few collection cycles for these new metrics to become available for your objects.
Ok, now that we have the metrics enabled, we can take a look at some of the new counters.
Browse to Operate / Workbench and search for an object. I’ll select a virtual machine in this example – the vCenter VM. Then select “Real Time Analysis” and under “Select View” pick “ESX Top”
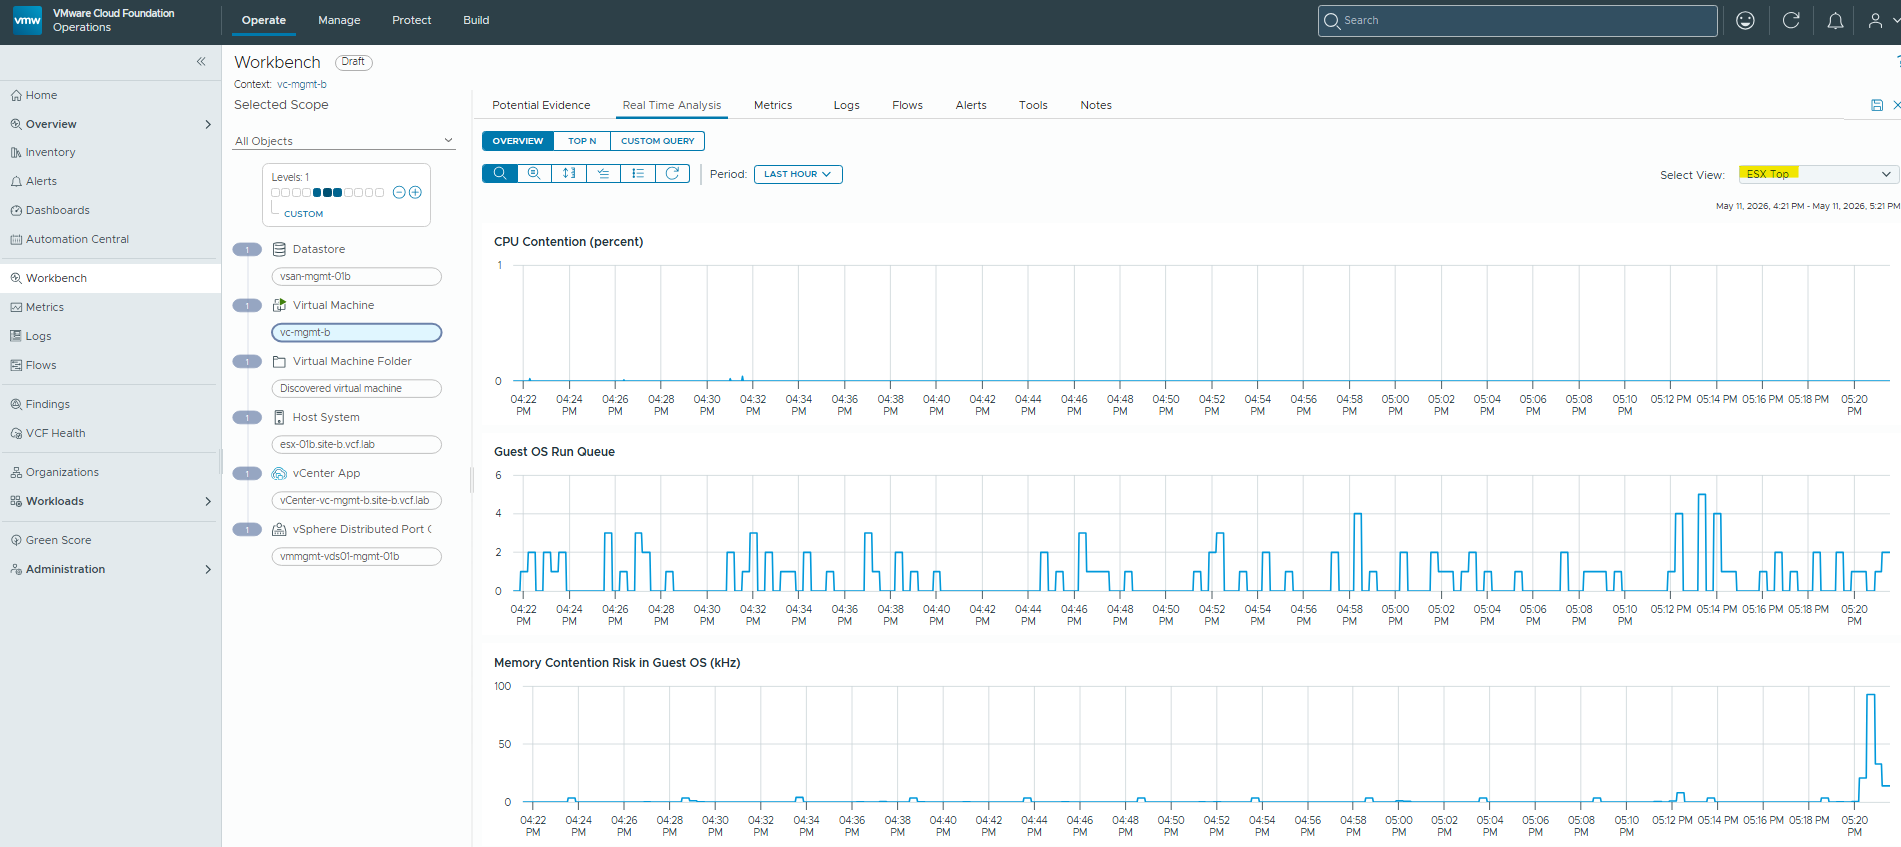
We can now see very granular (2 sec) statistics for the ESXTop counters affecting this VM.