Aria Operations Management Pack Builder – phpIPAM Part 3
Welcome back again!
In Part 1 we covered how to authenticate to your API endpoint.
In Part 2 we covered how to create API requests, turn the API responses into Aria Ops Objects, and configured the relationship hierarchy of those objects.
In this post we will build the MP, import it to Aria Operations and start to build some Dashboards / Super Metrics.
Section 1 – Build / Deploy / Configure
Browse to the MP Builder “Build” tab and click “Perform Collection”
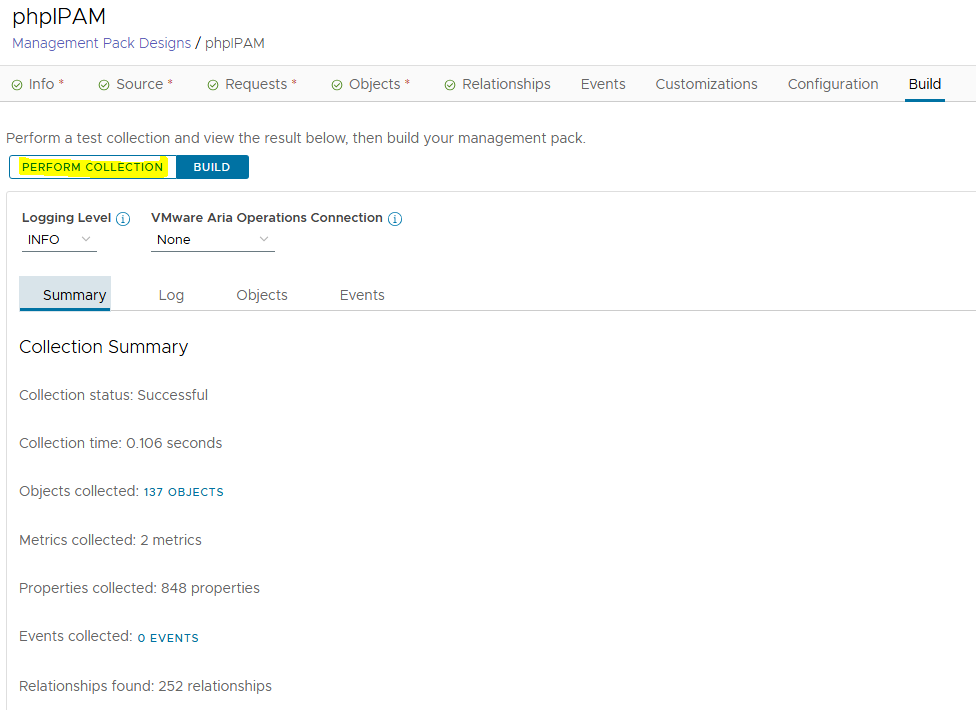
We can see that the collection was successful – we’ve pulled 137 objects and found 252 relationships. Looks good, now we can click the “Build” button which will generate the .pak file for us to import to Aria.
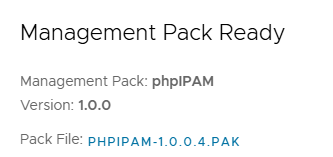
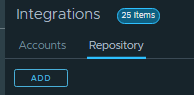
Download the PAK and we can browse to Aria Ops / Administration / Integrations to import it. Click Add.
Ensure you select “Ignore the PAK file signature checking” as we haven’t signed the file.
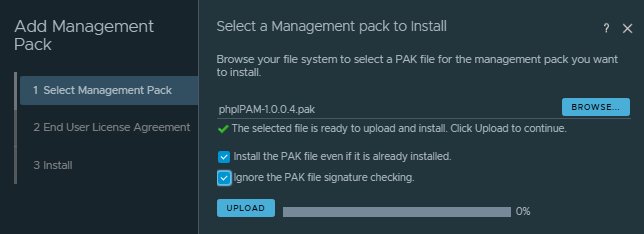
Click through and it’ll install the MP.
Now we’ll see the MP in the Repository and we can configure the account.
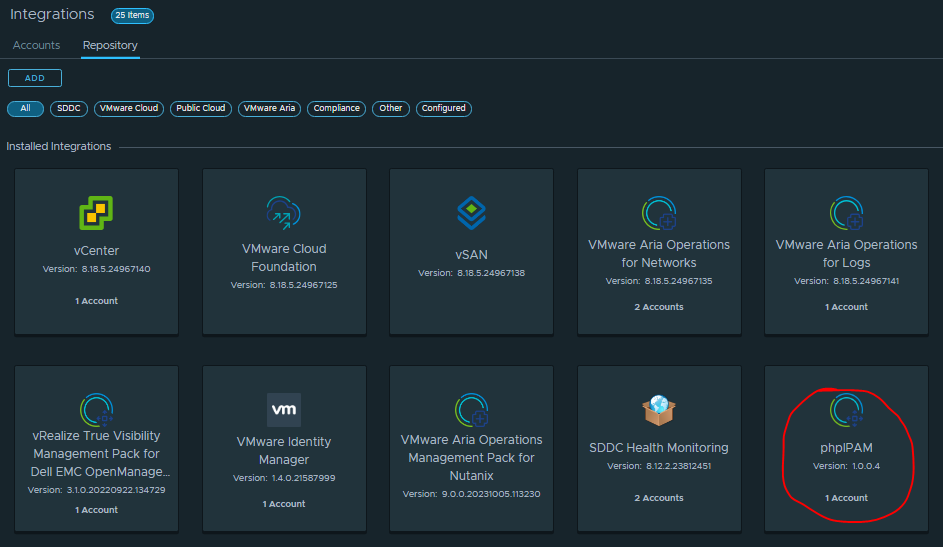
Browse to Accounts and click Add, select phpIPAM.
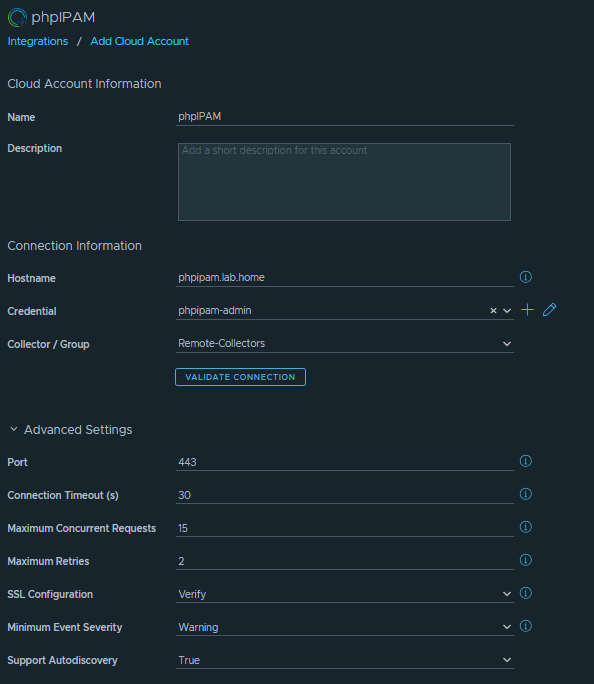
Here’s where we configure the phpipam server, login credentials and advanced settings if required. Click validate connection and if all is good you can save.
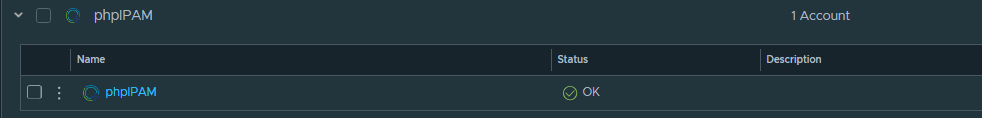
After about 5 minutes the collector should go to green status.
Now give it 15-20mins or so for a few collection runs, then we should have some objects to view in Aria Ops.
Section 2 – Dashboards / Super Metrics
Usually Management Packs will contain additional Dashboards, Views, Super Metrics etc. but we haven’t looked at that yet in the MP Builder.
We’ve got a chicken-egg scenario here where we need the objects to be in Aria Ops before we can start creating dashboards.
We’ll deploy the work-in-progress MP to get access to the objects, then we can create some dashboards.
Then we export those dashboards from Aria Ops, import them into the MP Builder, repack the MP with the dashboards to get the final version, and finally re-deploy Into Aria Ops.
Let’s check if we can see the objects. In Aria Ops, browse to the Inventory / click on the Integrations icon (jigsaw piece) / phpIPAM.
We should see the Subnets, with descendant IP Addresses. If we click on a known IP Address and go to “Topology” we should see the relationships we defined with the Subnet/IP and the Guest VM/IP.
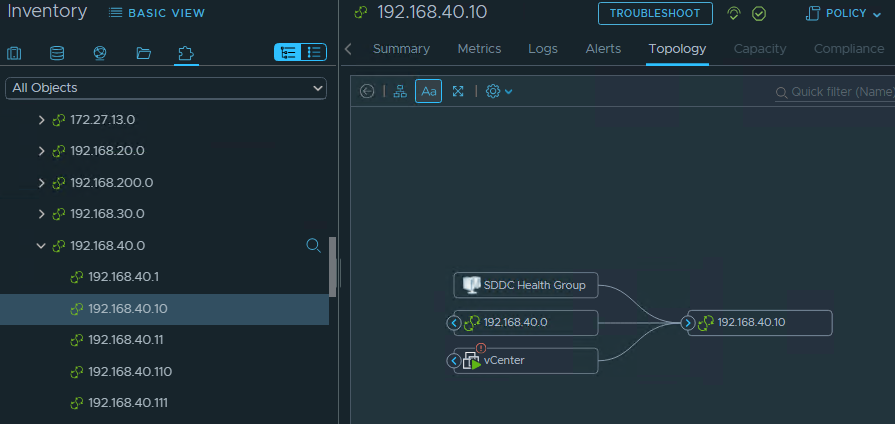
This looks perfect – subnets are listed, IP Addresses are under the correct subnets, and IP Addresses are linked to the Guest VM.
Let’s start building some dashboards. First up, I’ll create a view to list the subnets. Browse to Operations / Views / Manage Views.
Create a new view, we’ll call it “phpIPAM – Subnet List”.
Select “phpIPAM Subnet” as the subject, and we can select the fields we want to see in the list view.
I’ve selected Subnet Name, Mask, Description and VLAN ID.
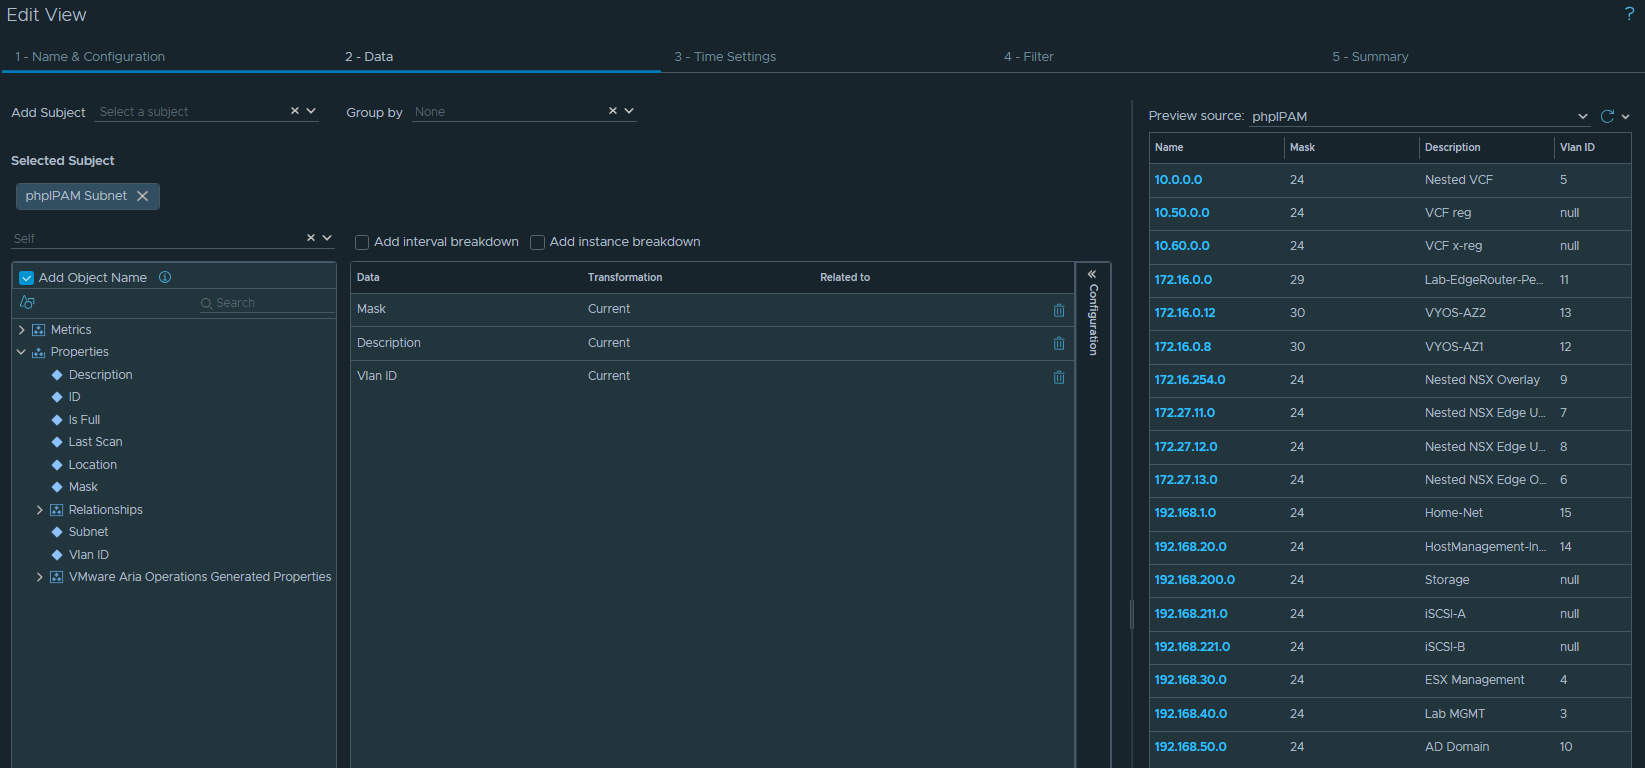
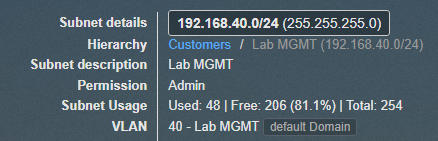
Now there’s some info missing that I want to see here – how many IPs have been assigned in the subnet, and what’s the available % ?
We can see this info in phpIPAM, but it’s not returned in the API call.
Compare this to the fields in the API response in MP Builder:
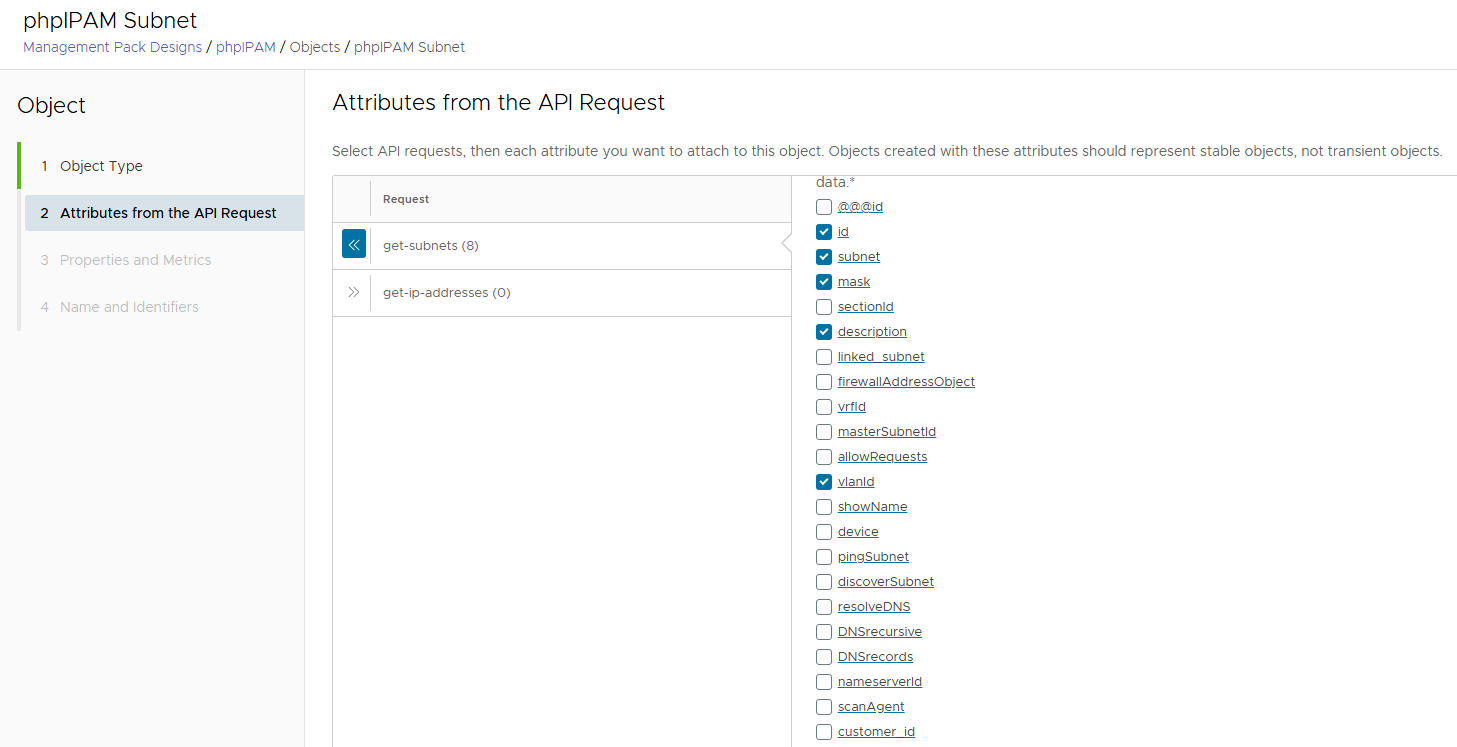
There’s no field here for Used/Free/% stats – we’re going to have to calculate this ourselves. Here’s where Super Metrics come into play.
We want to create a couple of super metrics, so we can add these fields into the view to give us our subnet utilization stats at a glance.
1. Count of IP addresses remaining in the subnet
2. Percentage of IP space free
Browse to Operations / Configurations / Super Metrics
Click “Add” and we’ll name our Super Metric “phpIPAM Remaining IPs”. Select phpIPAM Subnet under the Object Types.
Super Metrics can be a bit fiddly, here we need to calculate the total number of hosts in a subnet (based off the subnet mask), then subtract the number of assigned hosts.
The formula will look like this:
((2^(32-SubnetMask))-2) – COUNT(AssignedIPs)
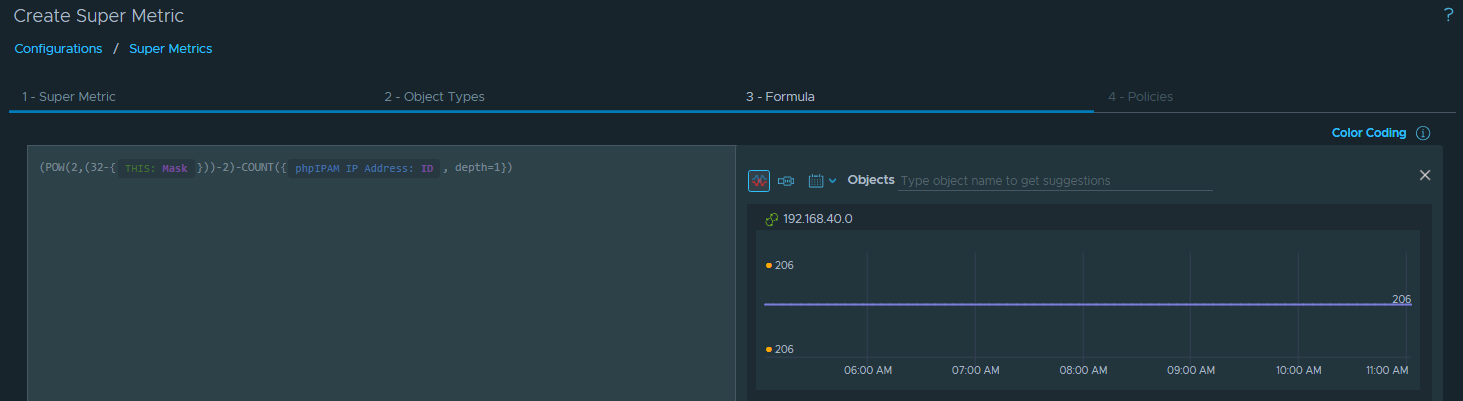
206 Free IPs in 192.168.40.0/24 lines up with what phpIPAM is telling us – this looks good.
Click Next, and enable this Super Metric in the default policy.
Now we’ll create another Super Metric for the percentage remaining.
This formula will be:
COUNT(AssignedIPs) / ((2^(32-SubnetMask))-2) * 100
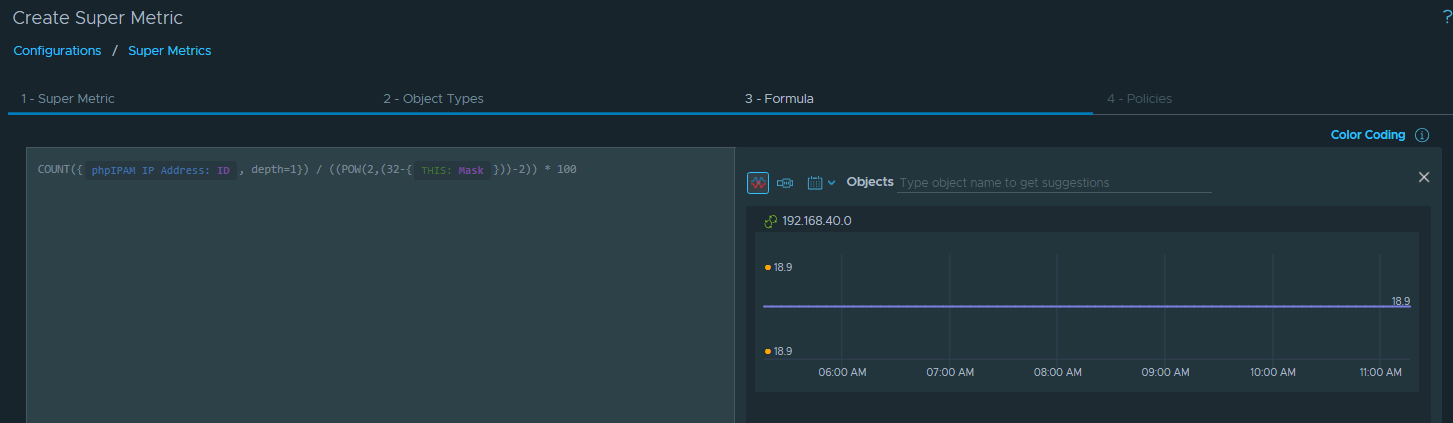
And we’re getting 18.9% used in 192.168.40.0/24 – this is perfect, we’ll hit Next, enable in the default policy, and click “Create”.
Now we’ll have to wait 10-15 minutes for some calculation runs, and we should then see those new metrics for selection in our Subnet View.
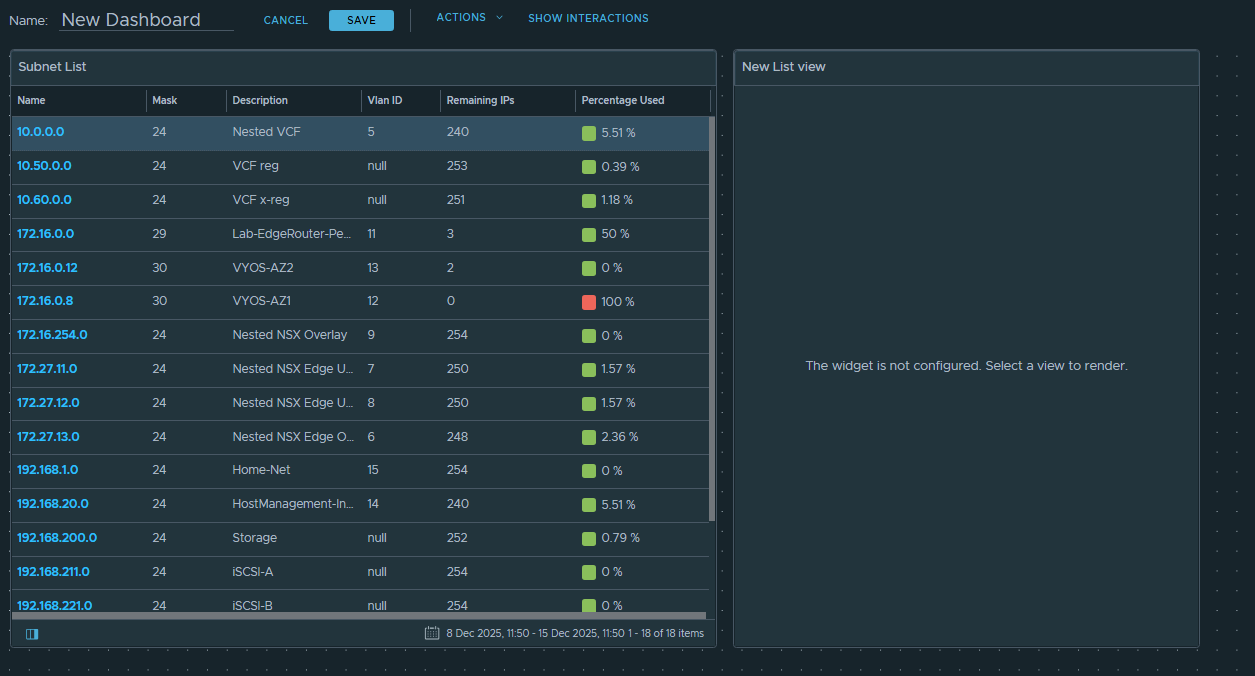
Go back to editing the Subnet View, and we can now drag over the new Super Metric fields we created:

I’ve updated the “Metric Label” to display a nicer name in the table, and for the % Used I’ve added some thresholds so we get colour bands on the metrics.
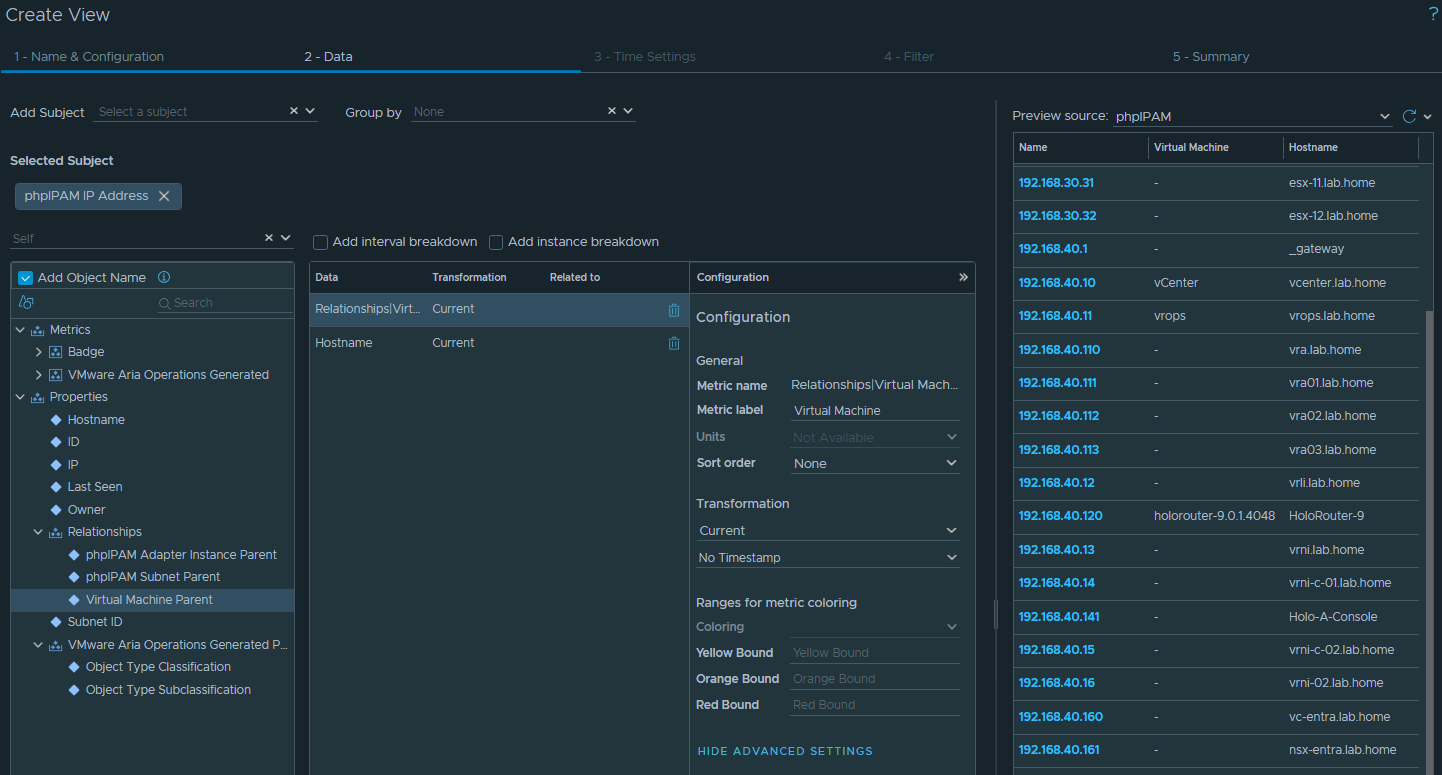
Now I’m going to create another List View for the IP addresses. This one will be a bit more simple – we’ll just add the VM Parent and Hostname fields
Now that we have our Super Metrics and Views configured, we’ll put these on a Dashboard.
Browse to Operations / Dashboards and click Create.
I’m going to drag a couple of List Views onto the canvas.
The first view will be the subnet list.
Click on Edit Widget:
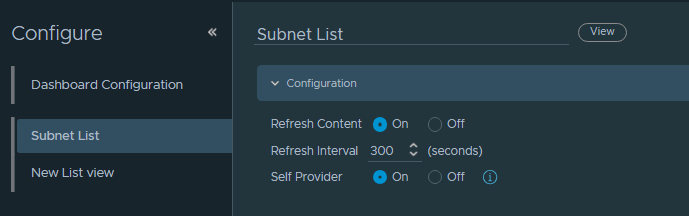
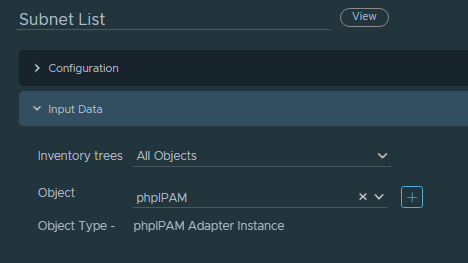
This list will be a “Self Provider” – this means that the input data source is static, we just want to display all subnets.
Select phpIPAM as the Object Source for input data.
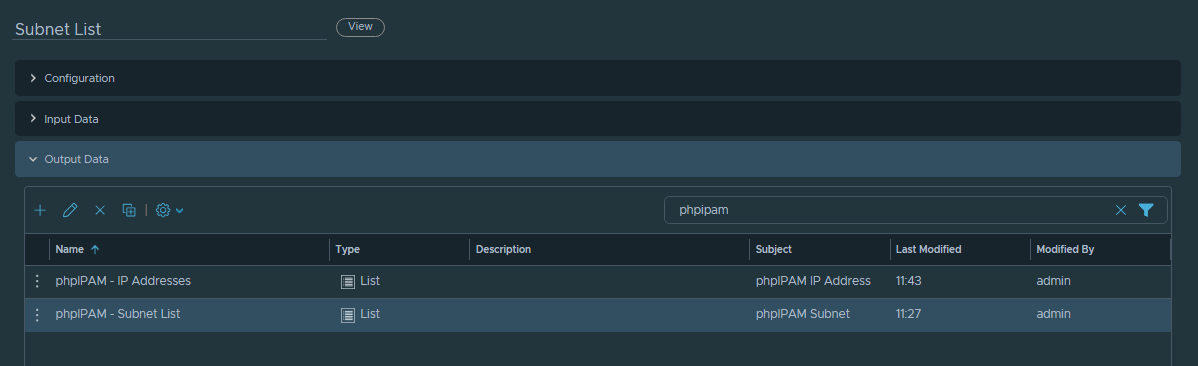
And for Output Data we’ll select the phpIPAM – Subnet List view we created earlier.
So far so good:
Now with the right side panel, I want this to display the relevant IP addresses when I click on a subnet in the left panel. We do this with the Input Data field.
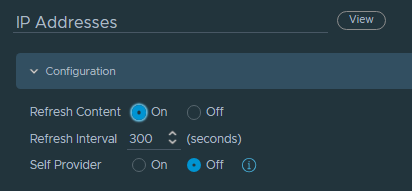
Edit the widget, and this time we have “Self Provider” turned off.
Select the IP Address view as the Output Data, then click OK.
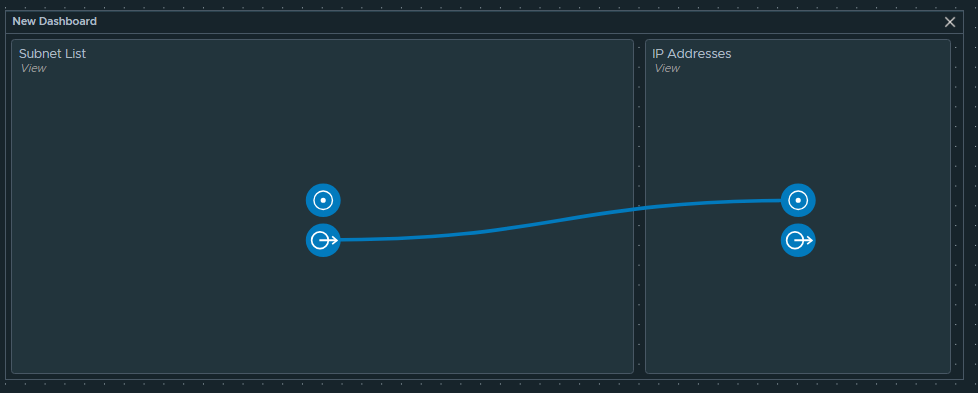
Now we need to set the relationship between the two widgets.
Click “Show Interactions” on the top toolbar.
Drag the “Outgoing Interaction” arrow across to the “IP Addreses” widget
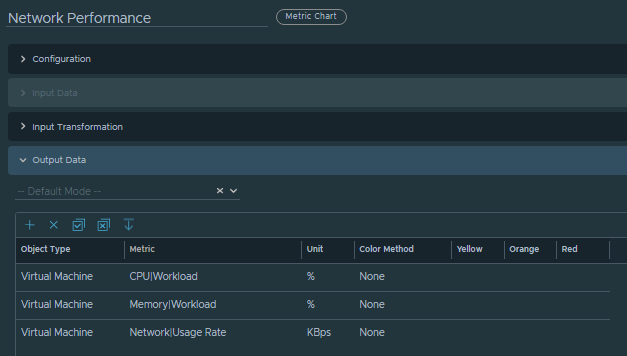
Now I’m going to add a couple more widgets – one to show a list of VM Properties, and one to show some Metric graphs (CPU/MEM/Network)
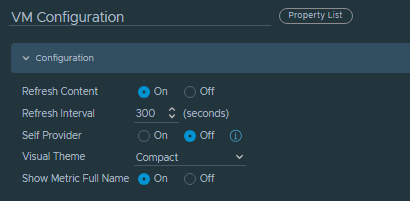
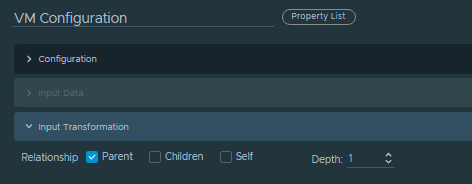
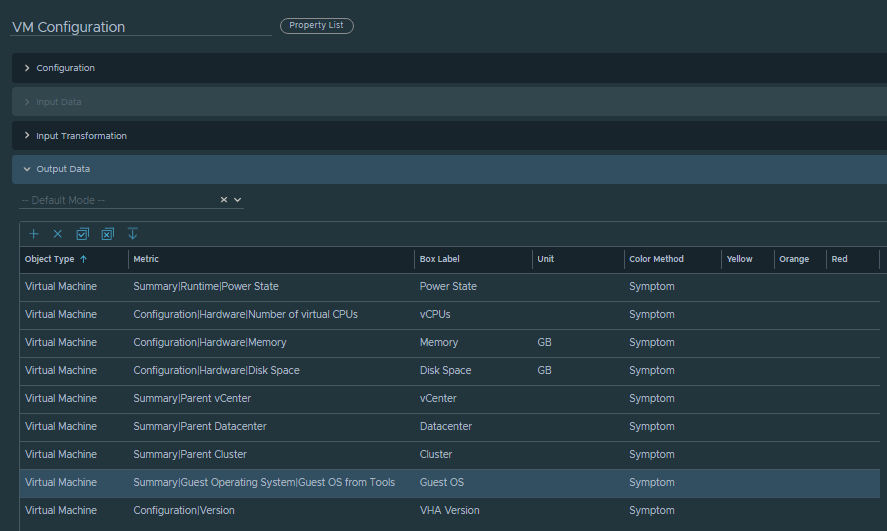
Add a “Property List” widget, and configure as per the screenshots below
And I’ll also add a “Metric Picker” widget.
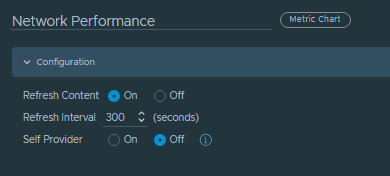
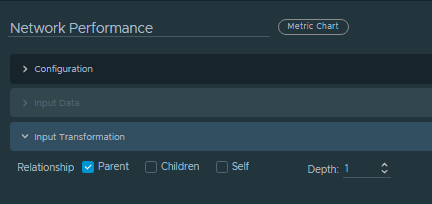
Click “Save” and we’ll configure the Interactions:
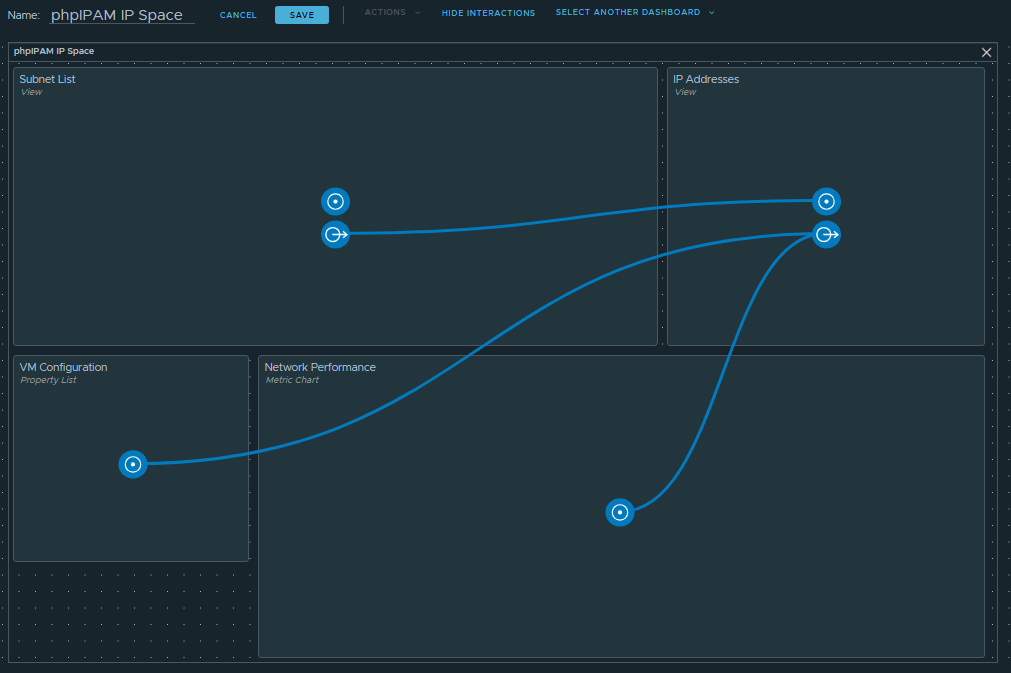
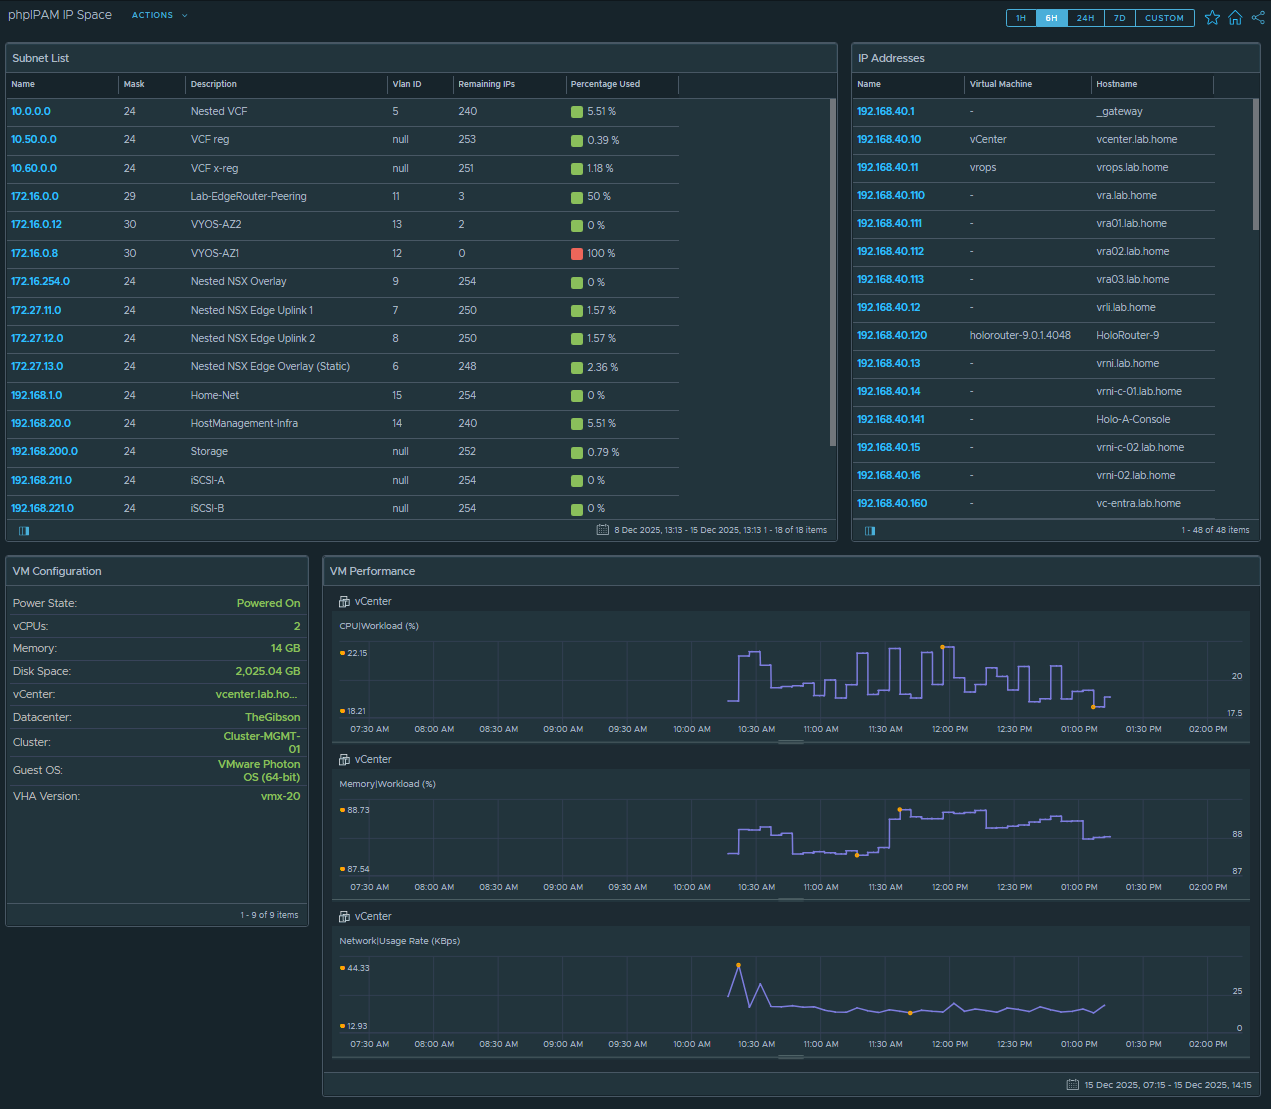
So this is basically it for the Dashboard – we now have a finished product.
That finishes us up for Part 3.
In the next post, we’ll export the Super Metrics and Dashboards, so we can put them into the Management Pack Builder to get a complete bundle.