Aria Operations Management Pack – phpIPAM Showcase
My latest blog series has covered the creation of a custom management pack for Aria Operations to monitor phpIPAM, mostly as an educational / technical demo project.
In this post we’ll cover the management pack installation and a showcase about the new dashboard we have to visualise the IP Addressing space, and how it links to the vSphere objects like VMs and Port Groups.
The MP and Views can be downloaded from my GitHub account. I’ve also included the MP Builder Project if you want to customise this yourself.
Part 1 – Installation
I’ll start with a clean Aria Operations install for this demo so there’s no lingering objects from my testing & development.
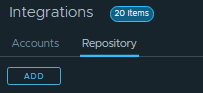
First, browse to Administration / Integrations / Repository and Click Add
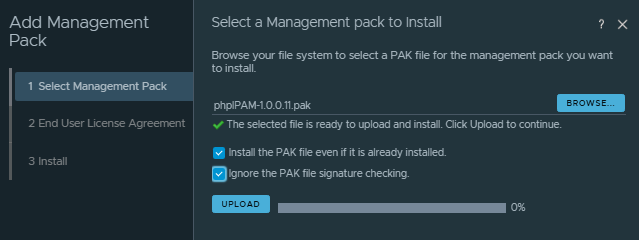
Upload the phpIPAM MP PAK file, and ignore the signature checking. Click through until the MP is installed successfully.
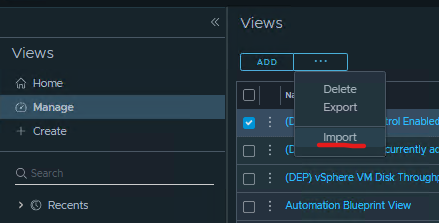
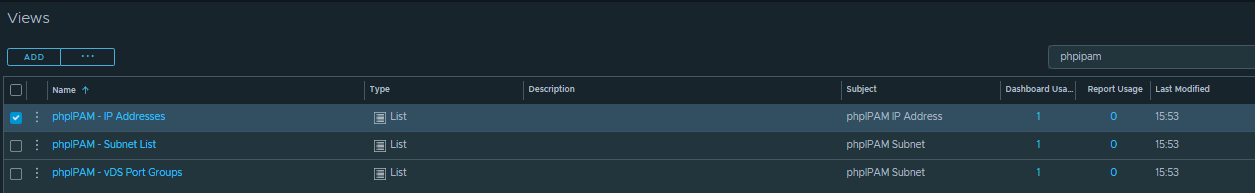
Now browse to Operations / Views / Manage and Import the file phpIPAM-1.0.0.xx_Views.zip to enable the phpIPAM Dashboard Views
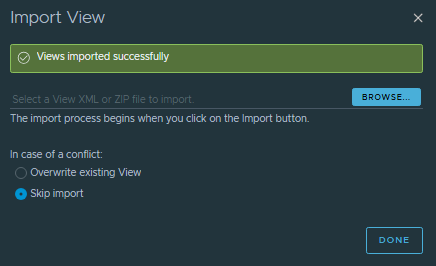
Now in the filter enter phpIPAM and we should see the views imported succesfully.
Now we need to enable the Super Metrics that were imported to ensure the dashboard fields for Free IPs / % Subnet Full work.
Browse to Operations / Configuration / Super Metrics. Edit each one and enable in the Default Policy

Repeat for both phpIPAM Super Metrics.
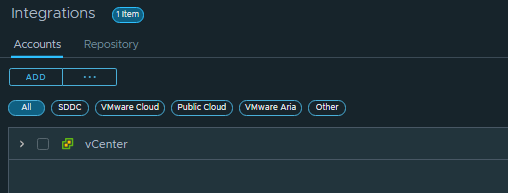
Now we will configure the connection to the phpIPAM server. Browse to Administration/Integrations and click Add
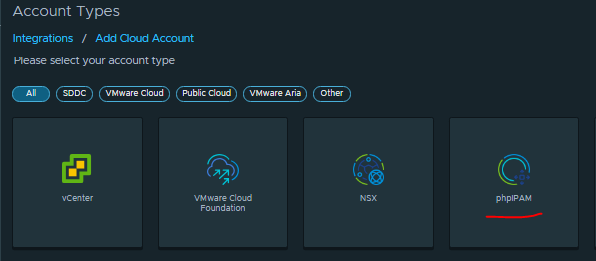
Pick the phpIPAM type adapter:
Configure a display name and hostname for your phpIPAM server. Also add your login credentials.
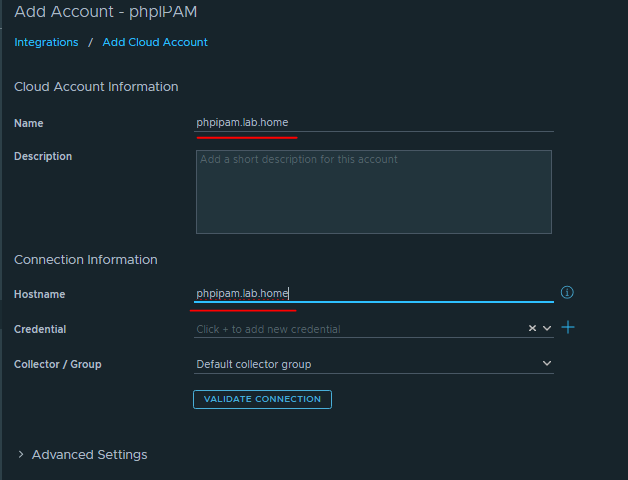
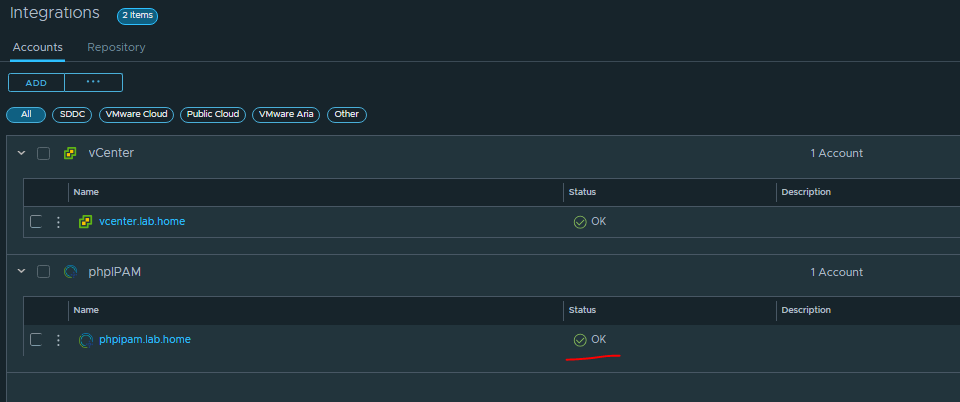
After a few minutes you should see the adapter status turn Green/OK
We’re now done with the installation, onto the showcase. It may take some time for all of the attributes to populate over a few collection cycles, but 10-15 minutes should be enough
Part 2 – Showcase
Browse to Operations / Dashboards and open the phpIPAM IP Space Dashboard

In the “Subnet List” widget, we can see the subnet details and statistics for free IPs etc.
Select a Subnet to populate the two widgets on the right side – the dvSwitch Port Groups associated with the same VLAN ID, and the “IP Addresses” list.
If you select an IP address in the “IP Addresses” widget that matches a VM in your vSphere environment, then it will populate the lower widgets – “VM Configuration” and “VM Performance”
And that’s it, hope you found this series informative. Aria Operations has a lot of capability out of the box, but with a bit of fiddling and an API/Documentation you can build a custom monitoring solution for pretty much anything, and create links & relationships into your vSphere/VCF environment.